Gantt Charts: Top 10 Features
10 Features of Top Gantt Charts
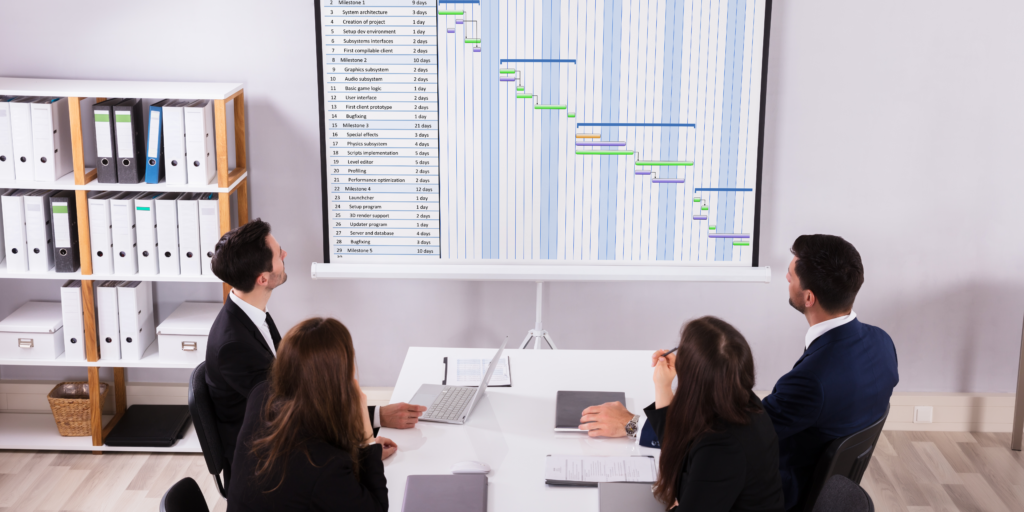
One of the best ways to manage all tasks in a project is by use of a Gantt chart. Although a basic to-do list may be enough to complete small projects at home as far as project management is concerned, there’s a need for a more comprehensive plan of action.
What is a Gantt Chart?
A Gantt chart is a type of bar chart that illustrates a project schedule, named after its popularizer, Henry Gantt, who designed such a chart around the years 1910–1915. Modern Gantt charts also show the dependency relationships between activities and the current schedule status.
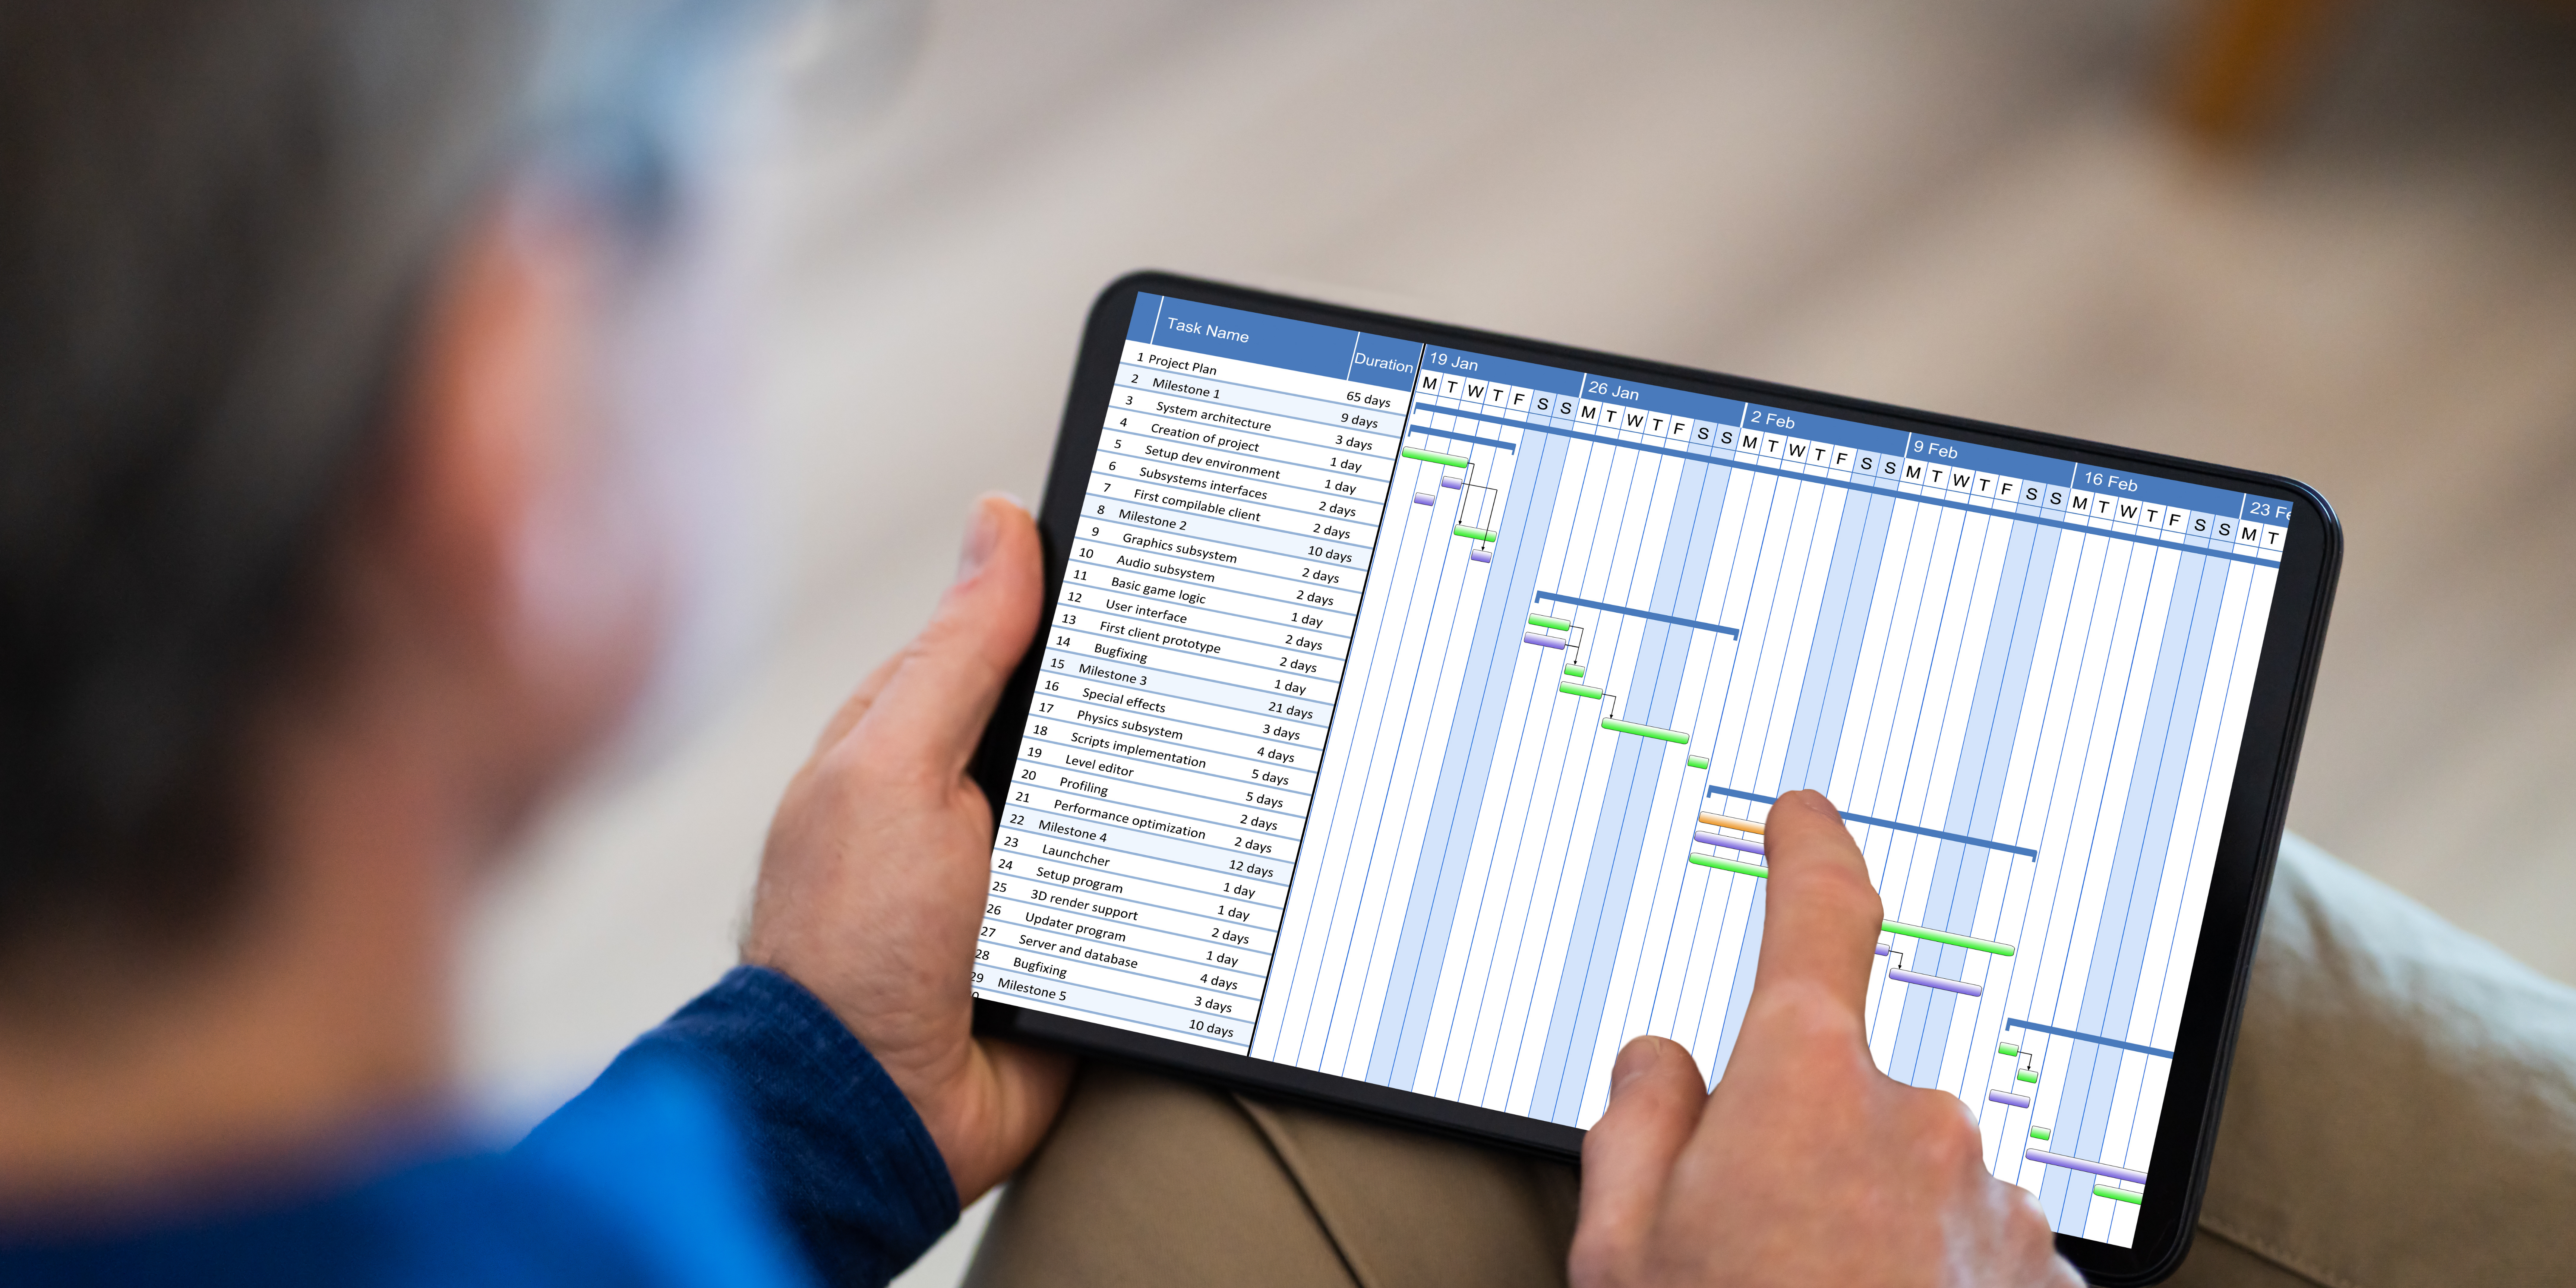
Scheduling software indicates various sub-tasks of a project and how they are connected with each other. It is a project management tool that shows everything that needs to be done, the duration each task is expected to take and the relation or connection between different tasks. This makes it easy for you to complete all tasks according to schedule.
Below are Features of Top Gantt Charts:
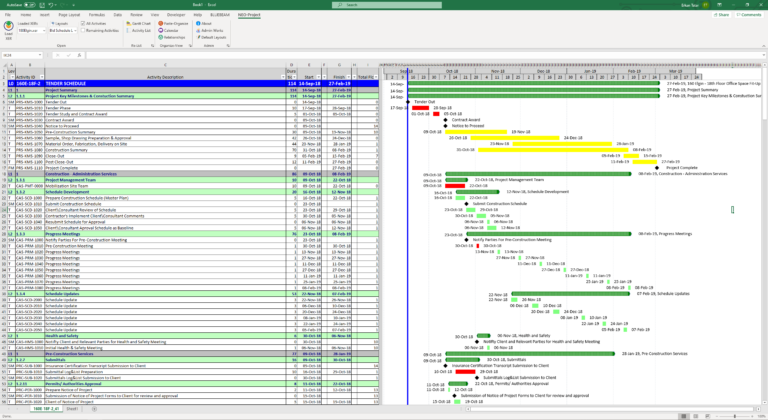
- Dates: This is one of the most important features of a Gantt chart. Dates are vital because they help you know when exactly the project is starting and when it should end. Besides, they also indicate when each task is supposed to take place. As a construction project manager, you need dates to properly execute the project and ensure it’s completed as planned. Dates are normally displayed on the upper side of the chart.
- Tasks: When undertaking a large project, you are bound to have numerous sub-tasks. It is not easy to keep track of all these tasks without good scheduling software. Scheduling software helps you keep track of every sub-task in a project. It is very easy to forget some tasks, especially if you are dealing with a huge project. But when you have everything listed down in a Gantt chart, you can be sure that nothing will be left out. You can even decide to list them according to their priorities.
- Bars: After listing all the sub-tasks, bars are then used to indicate the timeframe or duration in which every task is supposed to take. The main objective of this feature is to ensure that each sub-task is completed as per the allocated time. You should note that failing to complete even a single sub-task as planned can derail the entire project.
- Milestones: Designed to categorize the project into different stages to ensure it is completed successfully. As opposed to minor details, attaining different milestones gives you a sense of satisfaction when working on a project. Milestones are displayed as diamonds on scheduling software at the end of a specific taskbar. Milestones basically show you the overall progress of a project.
- Taskbars: Although many sub-tasks can be performed within a short time, there may be situations when you want to closely monitor how every task is being executed. In this case, the progress of the project is shown by shading taskbars. The portions or parts that have been shaded show that they have already been completed.
- Arrows: Despite the fact that your tasks can be carried out at any time, there are certain tasks that must be done before or after other sub-tasks. These kinds of tasks are shown using arrows between the taskbars on the chart. Doing so eliminates confusion and ensures tasks are performed in an orderly manner.
- Vertical Line Marker: This is another great component of a Gannt chart. The role of a line marker is to show the current dates on the chart. A vertical line marker gives you an opportunity to effectively manage your time because you are able to determine how much work is left to do. It also helps you to know is you are on course to complete the project on time or not.
- Task ID: In a world where competition is on the rise every day, you would want to juggle different tasks at a go. Incorporating a task ID on a Gannt chart makes it easy for every person involved in the project to quickly identify a task they need to work on. It eliminates time wastage by labelling tasks in priority order. A task ID also puts all your team members on one page when carrying out sub-tasks.
- Resources: Although not all charts include the names of people taking part in a project, it would be a good idea to clearly indicate the names of individuals and their specific roles at the start of a project. Identifying and issuing resources to every task allow you to manage your team effectively.
- Task dependencies: You may also indicate the task dependency in the form of numbers. This is a great way of finding relationships between tasks in a project. Numbers are used in tracking task dependencies instead of doing so manually.
In general, project management tools play a big role when it comes to managing projects. The software comes with several key features that make it easy for you to manage your project and complete it on time.
For example, you may be running a construction project and would like to complete it within a specific time. The best way to achieve this would be to use a scheduling software that will help you manage time and resources. Your software should include features like dates, milestones, taskbars among others.